Synthetic Polymer Contamination in Global Drinking Water
Final Report: May 16, 2017
Mary Kosuth, Elizabeth V. Wattenberg, Sherri A. Mason, Christopher Tyree, Dan Morrison
CONTACT INFORMATION FOR AUTHORS
M. Kosuth: kosu0003@umn.edu, 612-558-2153
E. Wattenberg: watte004@umn.edu, 612-626-0184
S.A. Mason: mason@fredonia.edu, 716-673-3292, Fax Number: 716-673-3347
C. Tyree: chris.tyree@orbmedia.org, 757-406-3478
D. Morrison: danm@orbmedia.org
ABSTRACT
Plastic pollution has been well documented in natural environments, including the open waters and sediments within lakes and rivers, the open ocean and even the air, but less attention has been paid to synthetic polymers in human consumables, such as fish, table salt, and beverages. Here we report a global survey of tap water from six regions on five continents. Of the 159 samples analyzed, 83% were found to contain plastic particles. Most of these particles were fibers (99.7%), between 0.1 - 5 mm in length. The range was between 0 and 57 particles per liter, with an overall mean of 4.34 n/L. The highest density of plastic per volume of tap water was found in North America and the lowest densities were found, collectively, in seven European countries.
INTRODUCTION
Synthetic polymer pollution is ubiquitous in natural environments. Ranging in size from 5 mm to 1 µm, microplastics exhibiting a wide variety of physical characteristics and chemical compositions have been found, often in surprising abundance, in remote corners of the Earth’s biosphere. Particles have been quantified in marine environments(1) that include segments of the pelagic biome(2), coastal habitats(3), deep sea sediments(4), as well as freshwater lakes(5) and associated tributaries(6). Particles have also turned up in Arctic sea ice(7), ambient air(8), and a plethora of biota such as seabirds, aquatic mammals(9), fish(10), and benthic invertebrates(11).
These plastic particles are a contaminant of emerging concern because they can adsorb PCBs(12) and bacteria(13) in concentrations higher than the surrounding environment. They can also leach synthetic additives, like phthalates, PBDEs, and bisphenol A(14).
While evidence of plastic pollution in the natural world quickly mounts, there are relatively few studies that focus on synthetic polymer contamination in human consumables(15,16,17). This study, possibly the first of its kind, seeks to enumerate and characterize the plastic particles found in samples of tap water collected from seven countries and one geographical region; Uganda, India, Indonesia, Lebanon, United States, Cuba, Ecuador, and Europe.
METHODS
Water samples were collected between January and March of 2017. In five cities, the samples were collected by institutional partners, three of whom were professional scientific service organizations, which include Difaf in Beiruit, EarthGreen in Quito, and ToxicsLink in Delhi, and two of whom were non-scientific partners, which include Jibu from Kampala and Klirkom from Jakarta. The rest of the samples were collected by Orb staff members and volunteers stationed around the world.
Each sample was collected by running the tap water source for 1 minute prior to filling a 500mL HDPE bottle to the point of overflowing. While leaving the tap water running, the water sample was dumped and filled twice before being filled a third time and capped. This was done to rinse the bottle prior to the final sample collection. A survey was filled out for each water sample, which included the sample collector’s name and contact information, day and time of collection, and information about the source and general use of the water taken. The survey form was then mailed to Orb Media, who tracked the samples, while the water sample itself was sent to the University of Minnesota, Minneapolis for processing. This arrangement allowed the water samples, identified only through a unique sample ID number, to be processed ‘blind’ without any preconceptions about the tap water source.
Tap water samples were processed for plastic particles using a method like the process developed by Liebezeit et al (2014)(15), briefly described below. The precise volume of each sample was determined prior to vacuum filtration through a 55 mm diameter Whatman cellulose filter with a pore size of 2.5µm. Sample bottles were rinsed three times with deionized water with the rinse water being run through the same filter. In order to aid the visualization of synthetic polymers, filters were then stained with 2 ml of Rose Bengal, a pigment that binds to organic material. Filters were visually analyzed using a dissection microscope (Leica EZ4W, 8-35X Zoom, Integrated 5MP Camera). Particles not stained by the Rose Bengal were agitated with a stainless-steel micro spatula to test each particle’s durability. Each piece that could endure this test without breaking apart was presumed to be plastic15 and was measured, cataloged, and photographed at 35X. All filters were stored in petri dishes for possible future analysis.
The ubiquity of synthetic polymers, especially airborne fibers, requires fastidious lab habits. To reduce potential sources of contamination during the procedure, all glassware was covered with a watch glass when not in use and washed thoroughly between trials. Work occurred in a laminar airflow cabinet and the workspace was wiped down every week. Filters were inspected under a microscope prior to use. Filtration times were recorded so that the window of time for potential contamination is known.
To further account for contamination, three different types of lab blanks were processed. First, the filtrate from each sample was filtered a second time through a new filter and cleaned glassware. These blanks, referred to as filtered blanks (n=159), were carried out to make sure each sample was filtered thoroughly. Additionally, lab blanks containing only deionized water were run once each day samples were processed. These blanks were called deionized blanks (n=30) and they were carried out to account for background lab contamination from atmospheric deposition, deionized water, and glassware. Finally, bottled blanks were run by filling two empty 500mL HDPE bottles with deionized water in the lab, just as the samples had been collected. The deionized and bottle blanks were processed in a manner identical to the tap water samples to account for polymer contamination, or background levels, that could be coming from either the collection receptacle or testing environment.
RESULTS
During the first three months of 2017, a total of 159 tap water samples were collected from eight distinct regions of the world: Kampala, Uganda (n=26), New Delhi, India (n=17), Jakarta, Indonesia (n=21), Beirut, Lebanon (n=16), United States (n=36), Cuba (n = 1) Quito, Ecuador (n=24), Europe (n=18). For each sample, the number of particles was enumerated as a combination as those within both the first and second (i.e. ‘filtered blank’) filtration. This secondary filtration step ensures all fibers in the original sample were extracted. Given the variability in sample volume, the density of plastic particle contamination was calculated as the number of particles per liter of water (n/L) in order to standardize the samples. The range of plastic particles within all tap water samples was 0 to 57, with an overall mean of 4.34 plastic particles per liter of water.
Of the 30 deionized water blanks that were run over the experimental period, five (17 percent) had one plastic particle in it. The remaining 83 percent had zero plastic particles.
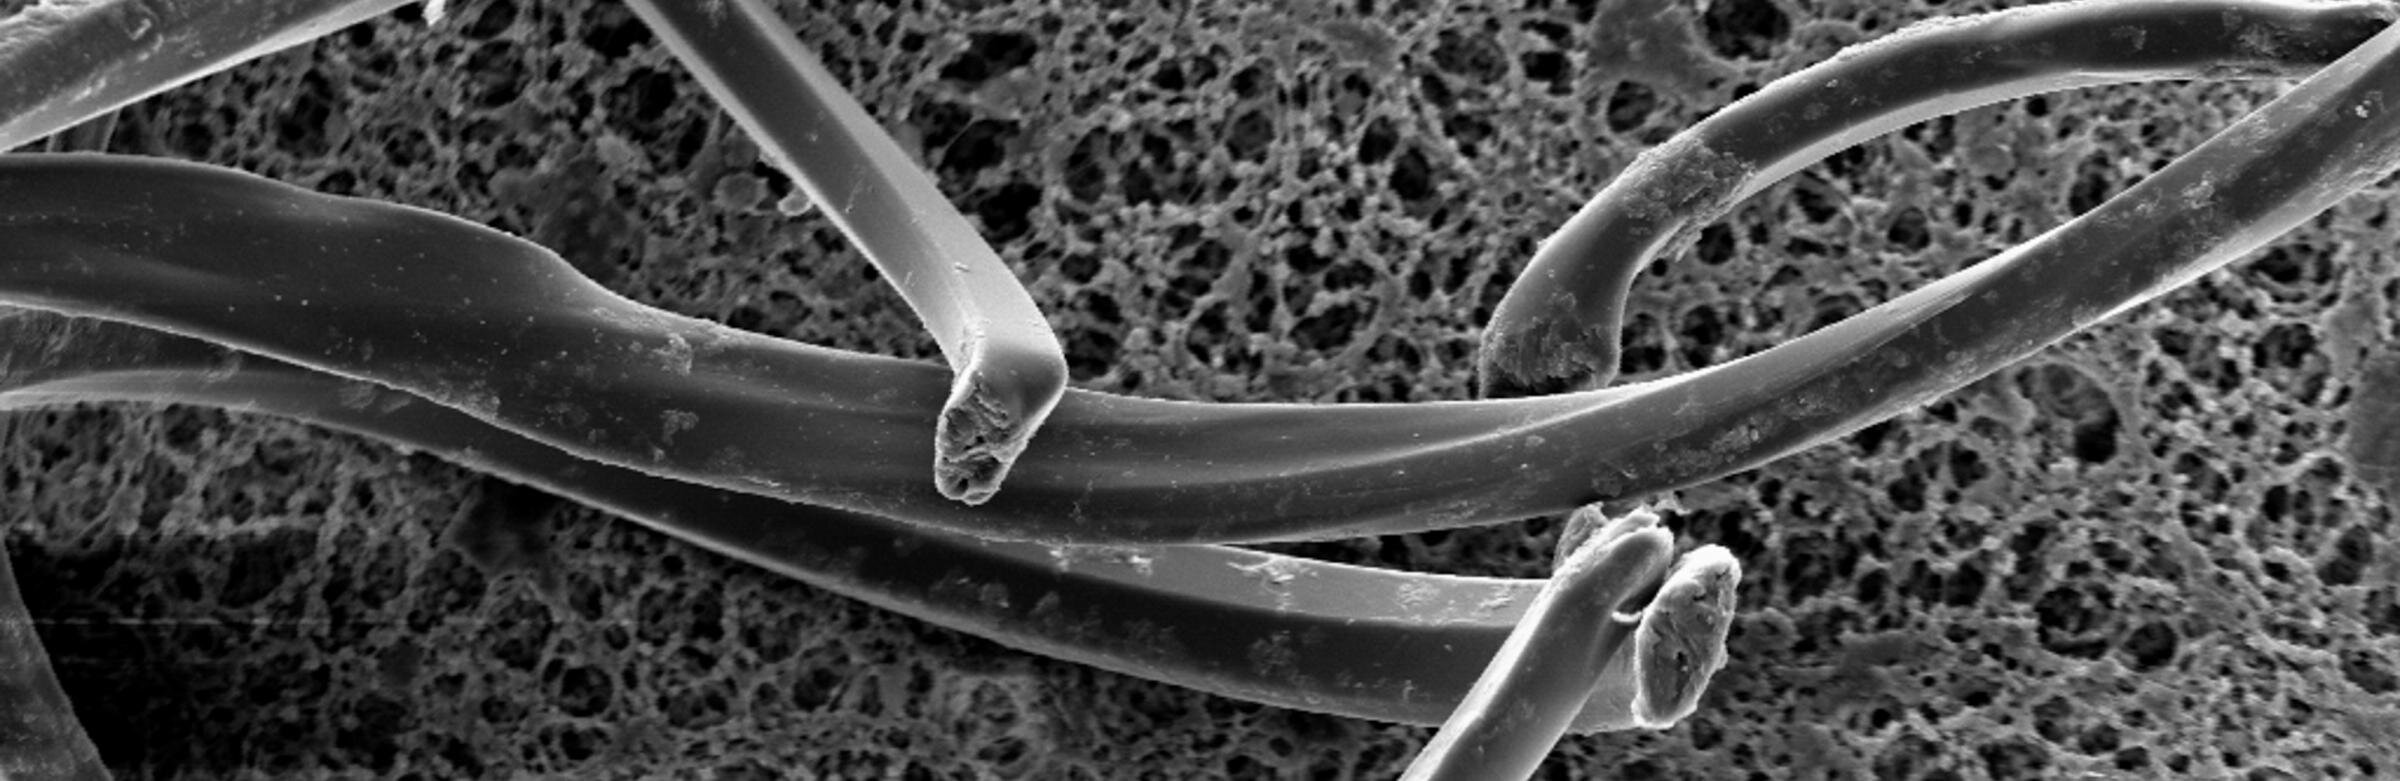
All but two plastic particles were fibers ranging in size from 0.1 mm to 5 mm in length. Most of these fibers were blue, black, red, brown, or clear (Figure 1).
FIGURE 1. EXAMPLES OF PLASTIC PARTICLES FOUND IN TAP WATER.

(A) PLASTIC FRAGMENT, 1 MM IN LENGTH FROM INDIAN SUBCONTINENT TAP WATER SAMPLE.
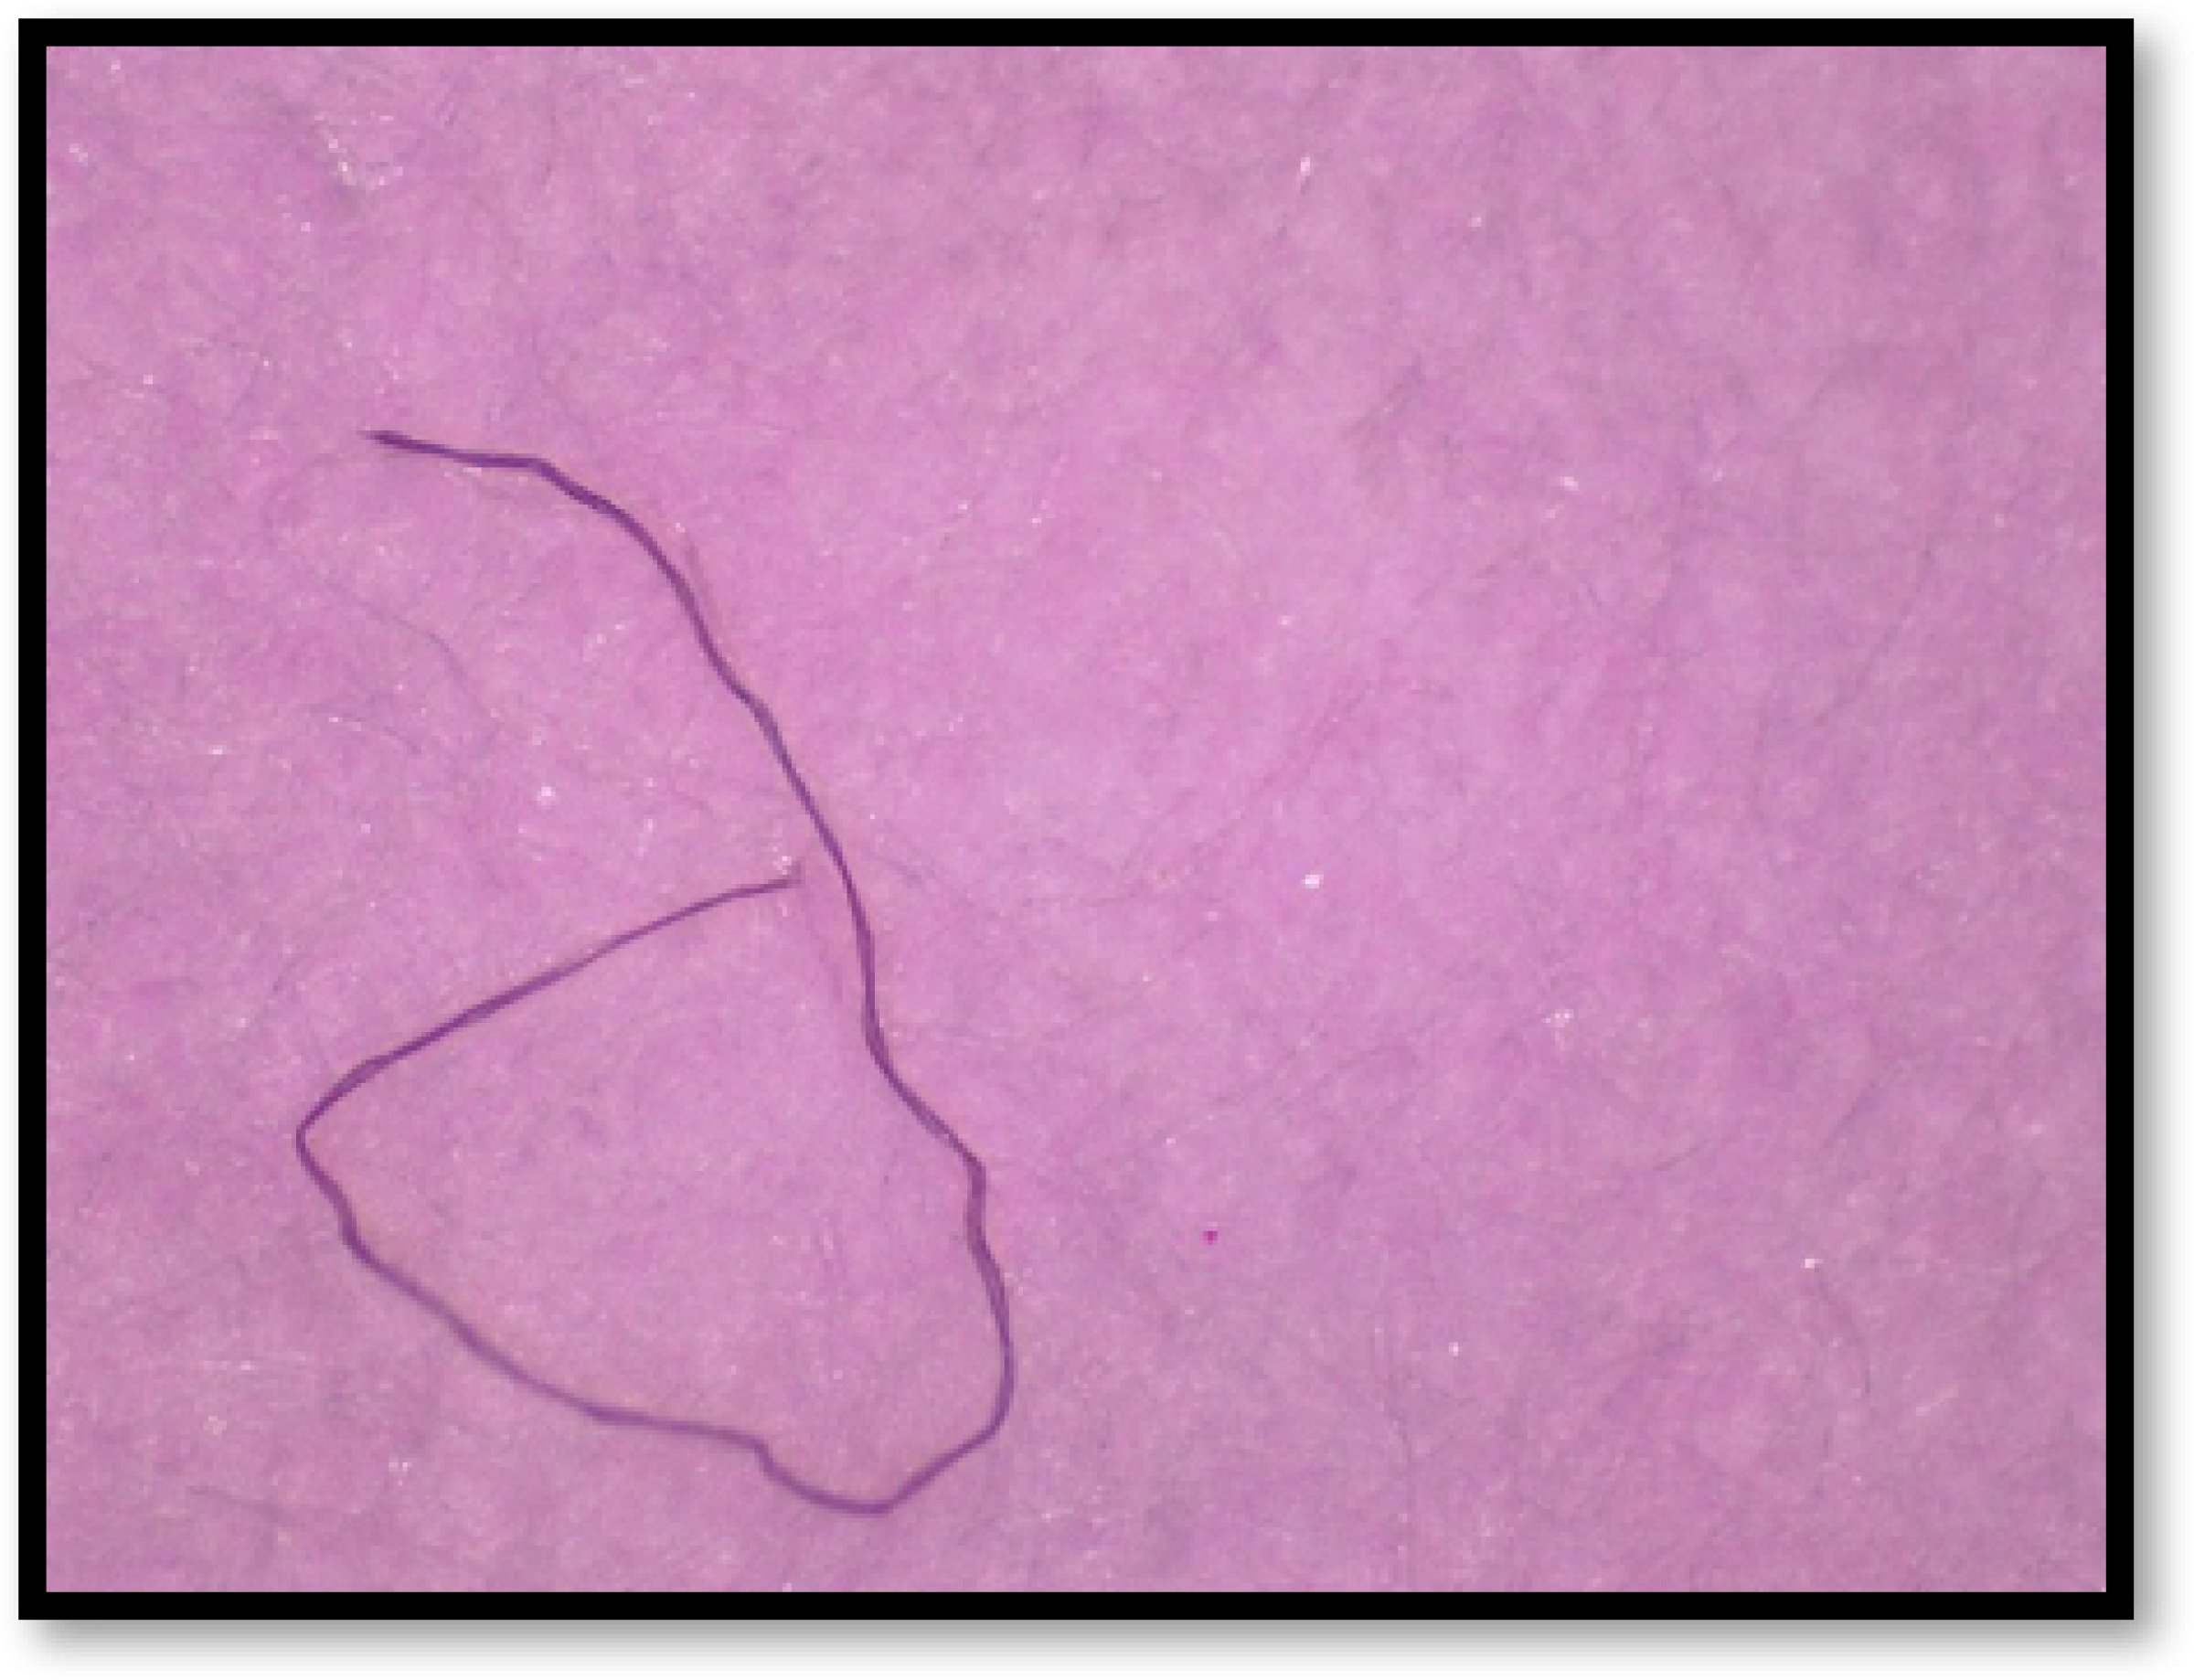
(B) PLASTIC FIBER, 2.5 MM IN LENGTH FROM U.S. TAP WATER SAMPLE.
DISCUSSION
When comparing plastic contamination in tap water by region, the United States and Lebanon had the highest percent of plastic detected at 94% each (Figure 2). However, there was a significant difference between these two sampling locations, both in sample size and geographical range. The United States had nearly twice as many samples as Beirut. Also, the U.S. samples were taken from a wide range of locations representing both coasts and the Midwest, while samples from Lebanon were confined to a smaller geographical area. It should be noted that there were three bottled water samples that were purchased in the United States that are not included in Figure 2. Europe, where 18 samples were pulled from seven countries, had the lowest percent detected at 72%.

PERCENT OF PLASTIC PARTICLES FOUND IN FIVE CITIES, TWO REGIONS, AND DEIONIZED WATER BLANKS.
Since this is the first global tap water survey of plastic pollution to have been completed, the results of this study serve as an initial glimpse at the consequences of human plastic use/disposal rather than a comprehensive assessment of global plastic contamination. These results call for further testing within and between regions. Future tests should include more information about water sources and ground filtration methods prior to human use (if any), to better understand potential pathways of contamination.
To provide context to the numbers, per the National Academy of Medicine, men should consume 3 L and women should consume 2.2 L of beverage per day. If these beverages consist of tap water, or drinks derived from tap water (such as coffee, tea, or reconstituted juice), a man may consume as many as 14 plastic particles a day, while a woman could consume up to 10 plastic particles a day. These daily doses add up to an annual total of over 4,000 for men and over 3,000 for women. These plastic particles are in addition to plastics potentially consumed in other products, such as sea salt, beer, and seafood(18).